
How To Guide: Flagsmith Grafana Integration

Grafana has become the de facto observability tool for engineering teams worldwide. As an open source tool, it’s trusted and used in production environments to understand patterns of traffic, user activity, and other metrics. With the Flagsmith Grafana integration, feature flag change events from Flagsmith are added to Grafana as annotations.
This integration lets you gain valuable insights from your existing dashboards. You can see not just when and which change was made, but what impact it had on your product, too. Plus, it lets you connect open source tools in an open source stack!
Use Case
If you use Grafana, this integration lets you see the impact and changes on the application when a feature flag is toggled.
For instance, suppose you have a Next.js website and modify the landing page functionality using a feature flag. By observing the Grafana dashboard, annotated with periods when the flag is activated, you can visualise and understand how the app's performance, traffic, and other metrics evolve.
How to Set Up the Flagsmith Grafana Integration
You’ll need a Grafana account and a Flagsmith account to set up the integration. If you don’t use Flagsmith yet, you can get set up (for free). Once that’s done, let’s set up the integration!
We are using the FastAPI project for the demo as this project has everything set up and we can run everything with the help of Docker Compose locally.
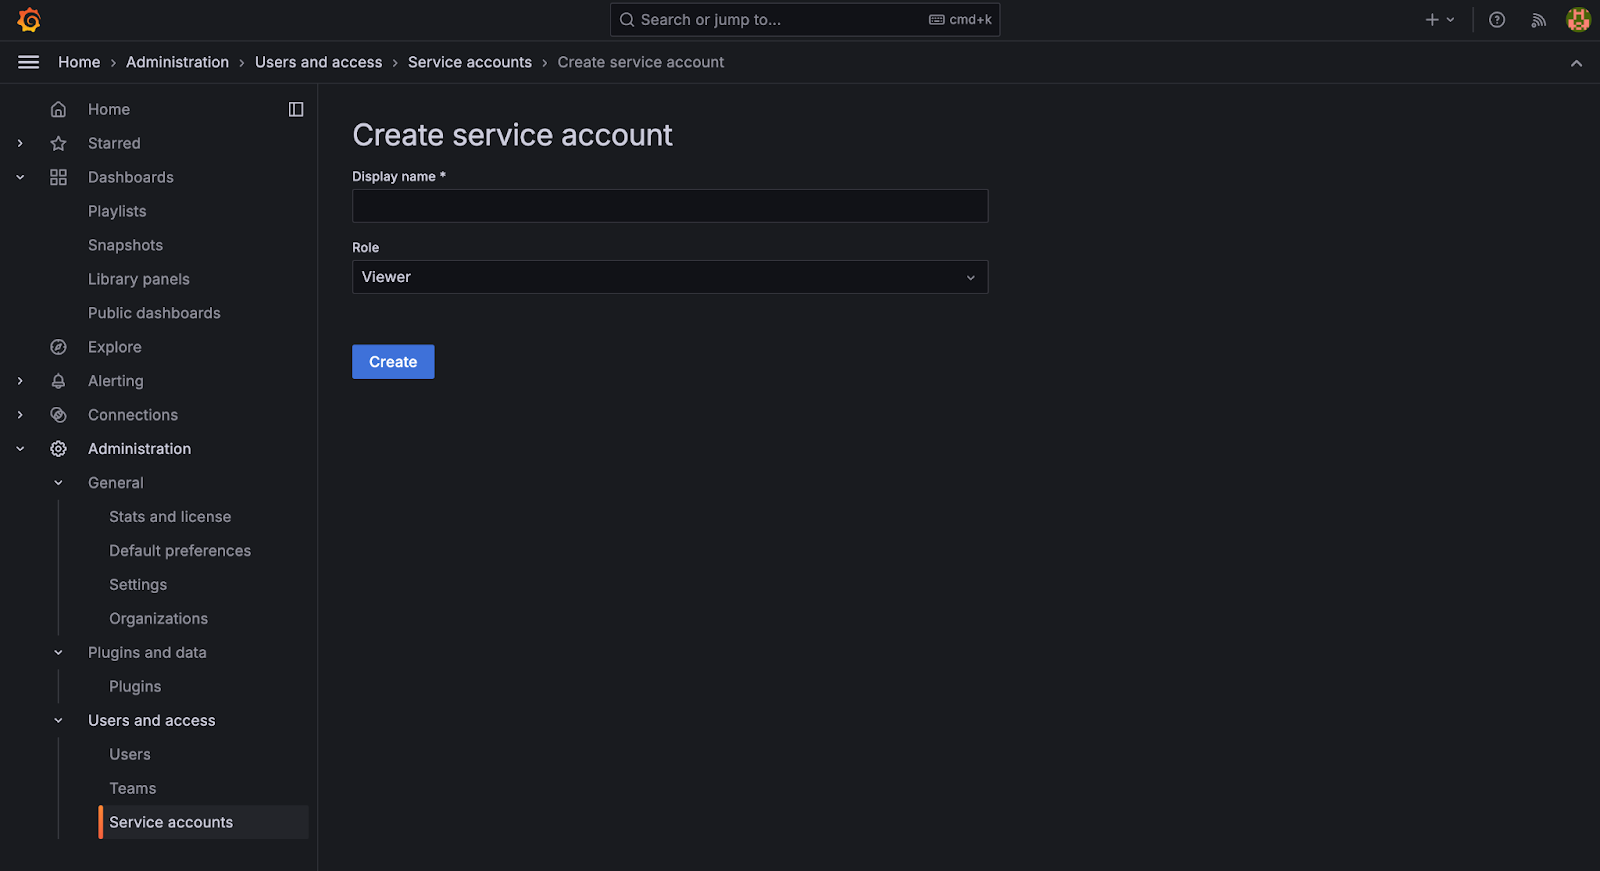
After running it, open Grafana and log in to the Grafana Dashboard. To use Flagsmith Grafana integration we first need to create a Service Account and get a token. To do that navigate to Administration > Users and Access > Service Accounts. Create a service account and give it a name and the role of “Editor,” so that it has the necessary permissions to work.
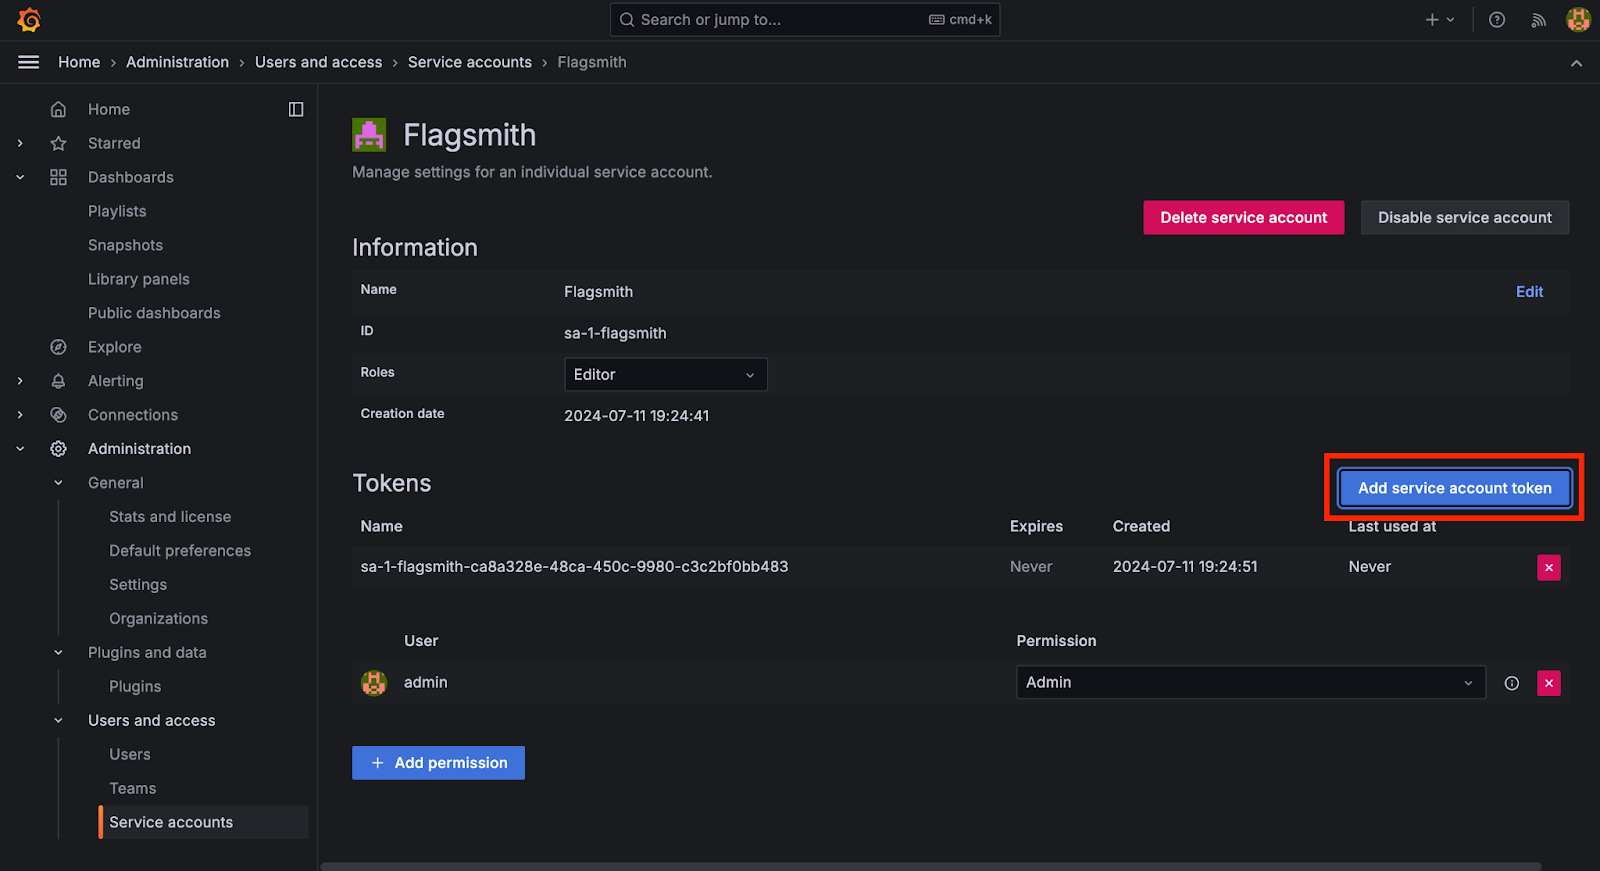
After that, the window below will open up. Click on “Add Service Account Token” and generate a token. Save the generated token, as we will use this in the next step.
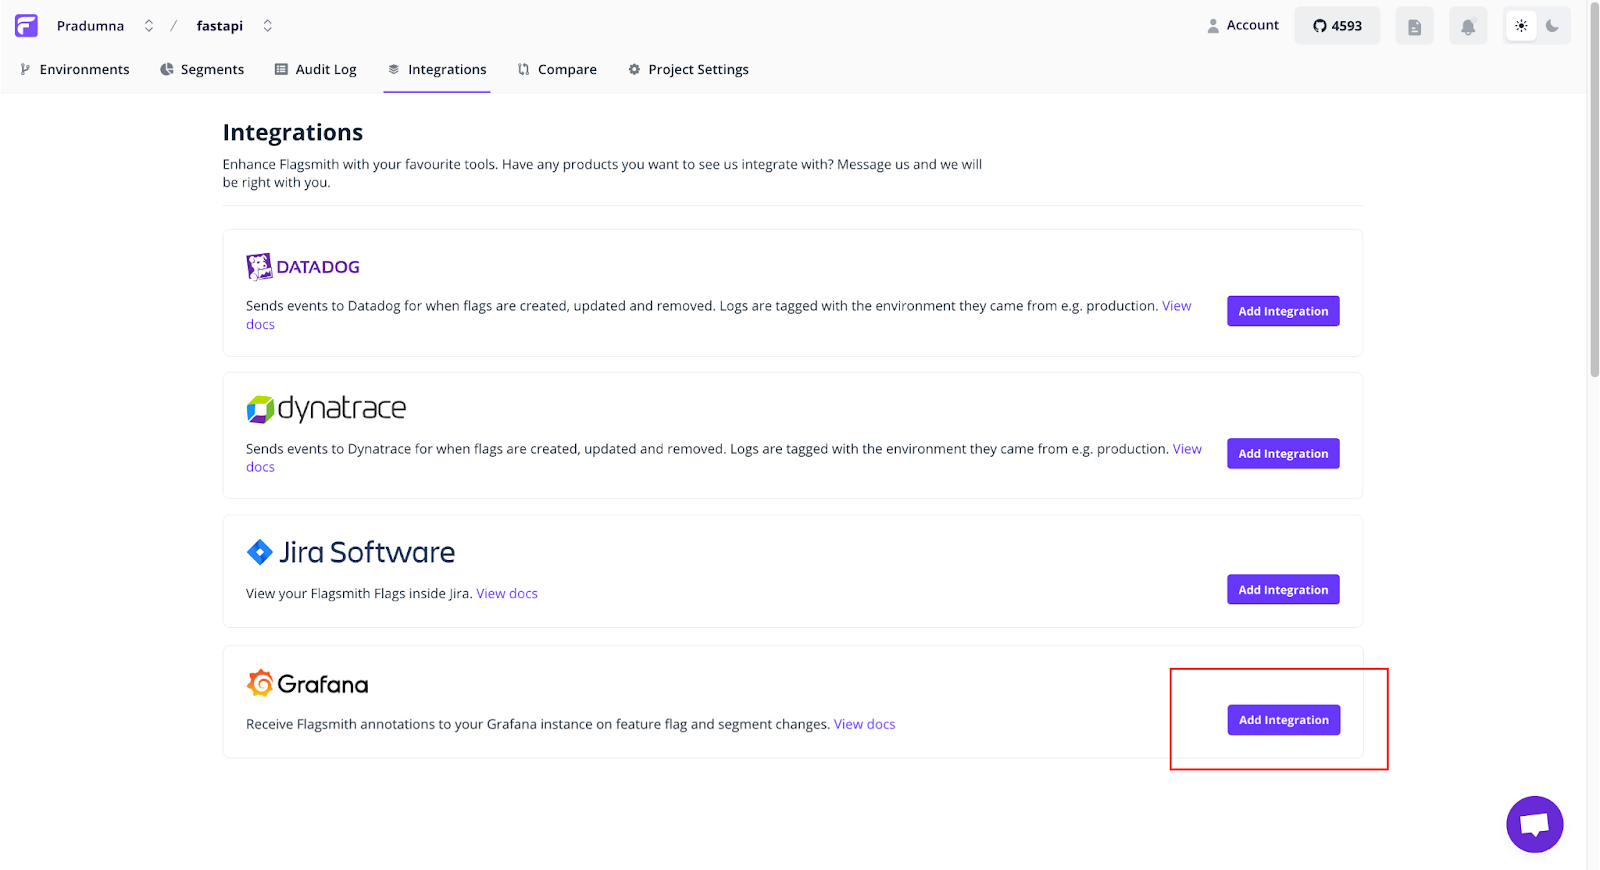
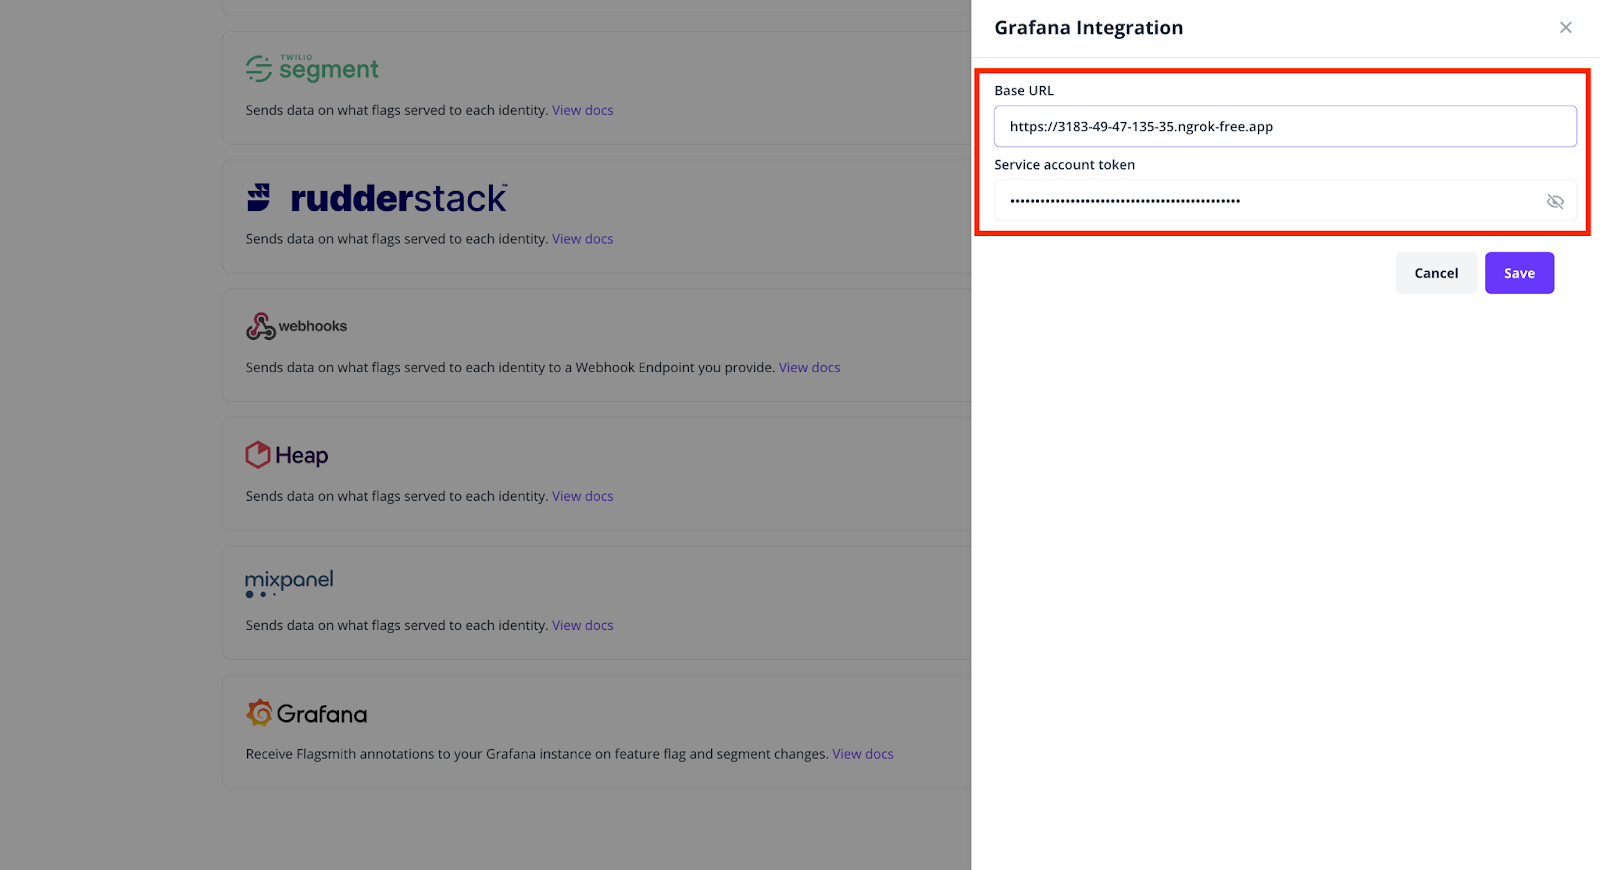
Now, head over to your Flagsmith Dashboard. Make sure you have an organisation and project set up. Then, click on “Integration” and find the Grafana integration. Click on the “Add Integration” button.
A side menu will open up and ask for the Base URL of the Grafana Dashboard and the service account token we generated earlier. Paste the URL of your deployed dashboard and ensure it’s publicly accessible via the link. In this example Grafana is running locally on localhost:3000, so we can’t use a local host URL as it is not publicly accessible. Therefore, we need a public URL. For this purpose, we can use Ngrok or any other tool to port forward it.
Once you are done with that, click on save. Now head back to the Grafana dashboard and click on dashboard settings

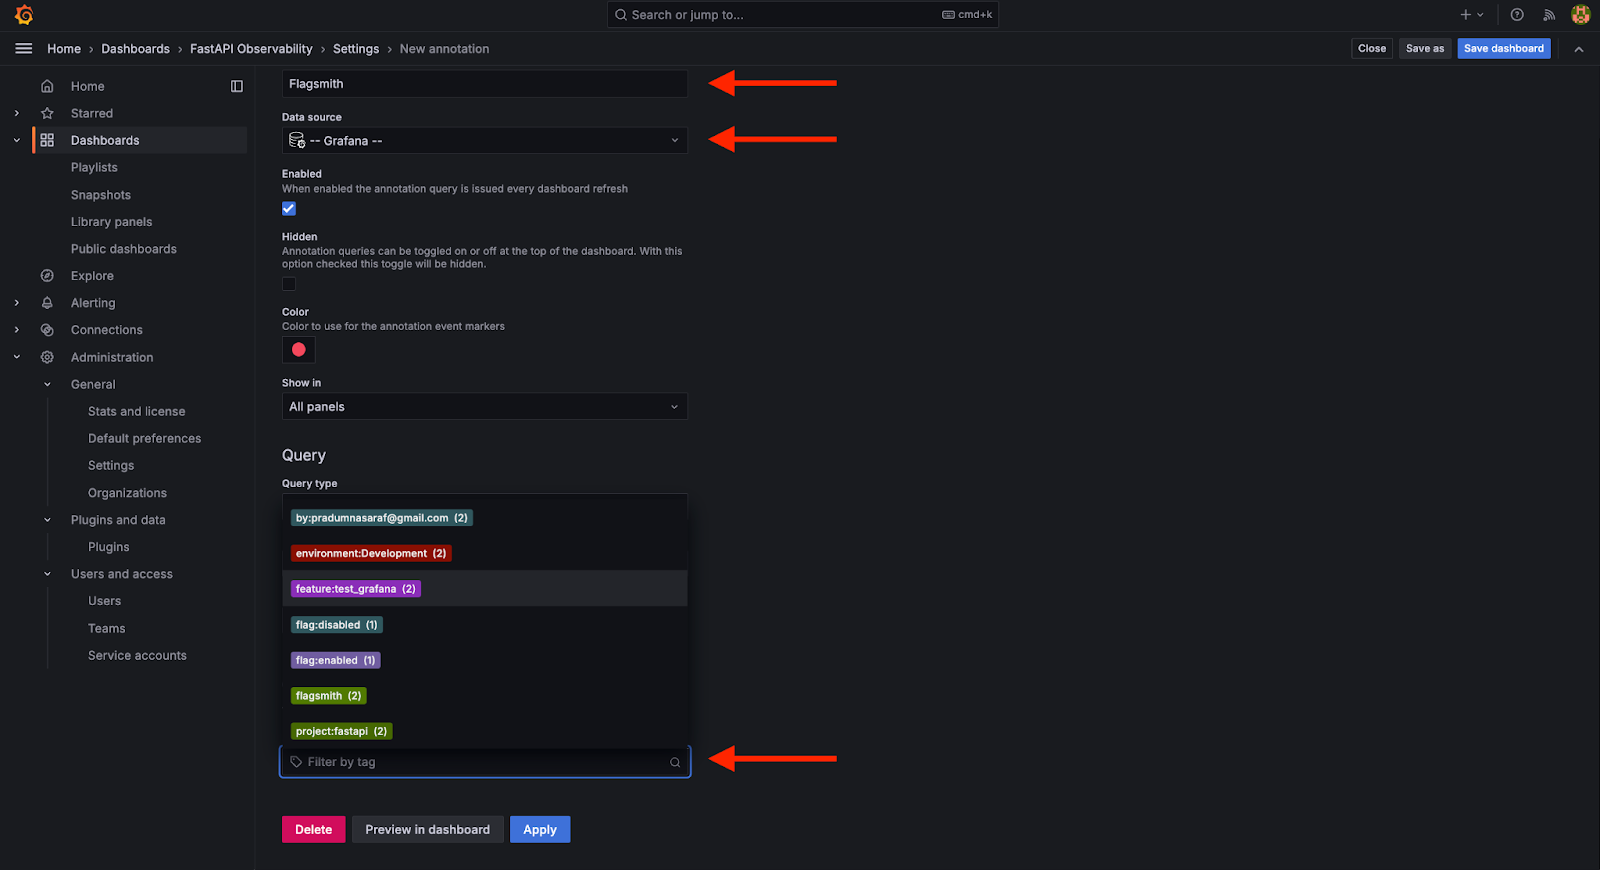
Now, click on the Annotations tab and add a new annotation query. Give it a name and select "Grafana" as the Data Source from the dropdown menu. Filter by Tags. If the tags are not showing up, try toggling a feature on and off from the Flagsmith Dashboard; all the tags will start showing up.
We have many options in tags (filter by). We can filter by the user by selecting their email, and when this person enables a flag, we can see it in the dashboard. Or we can choose other options, such as the environment, a particular project, segment or whether a flag is enabled or disabled. Choose which kind of annotation you want to track, and those will show up on the graph when they are enabled.
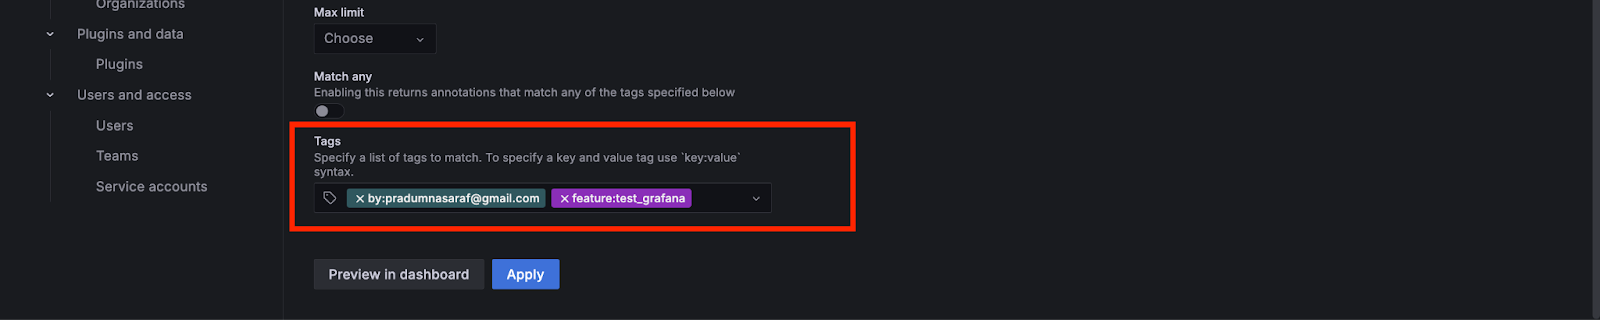
For this, I selected email and a feature flag we created called test_grafana. So, now whenever this user makes any changes to the feature flag, we can see it on the dashboard, or whenever someone enables or disables the test_grafana flag.
Now, to test if our annotations are working, we will turn on the test_grafana flag from the Flagsmith dashboard. As soon as we turn on the flag, the annotation will pop up in the Grafana dashboard. When we turn it off, we will see another annotation on the graph.
That’s it. That is how it’s simple to integrate Flagsmith with Grafana!
Benefits
- Improved Visibility: Your team gains enhanced visibility into when flags are enabled, allowing for more informed actions.
- Dashboard Integration: Easily integrate with your existing monitoring dashboard without the need to create a separate one or do content switching.
More Reading/Next Steps
- Set up the Grafana integration from our Docs.
- Check out the Flagsmith GitHub repo. This is where you can track integration updates and let us know what else you'd like to see. Don't forget to give it a star to show your support.
- Check out the other Flagsmith integrations via the Integrations tab in your Flagsmith dashboard.


OpenTelemetry, without the vendor lock-in: Introducing full observability for Open Source and Self-Hosted Flagsmith customers


.png)
.png)

.png)

.png)


.png)


.webp)