
Integrating your Flagsmith Project with Datadog: A Step-By-Step Guide with Real-Time Metrics

The Flagsmith Datadog App integration offers a wide range of feature toggling capabilities out of the box. This guide walks through the steps for integrating Datadog with your application to track all feature flag updates.
How does the Datadog integration help?
Due to the enormous power that feature flags add to your application, they are quickly becoming an essential part of a company's infrastructure. As that happens, performance becomes more critical and it becomes more important to monitor flags to make sure everything is working as intended. With the Flagsmith and Datadog integration, you can monitor the performance of feature flags alongside the rest of your tech stack!
Plus, you can now enrich Real User Monitoring (RUM) telemetry with Flagsmith's feature flag data for deeper visibility and a more comprehensive understanding of how flags are affecting your application's performance and user experience.
Let’s get started!
In this tutorial we will assume that you already have an application that is using Flagsmith for feature flag management. If that’s not the case, please get started with the Flagsmith app here. (Or contact us if you have any questions.)
Add the Flagsmith integration in Datadog
- Log in to Datadog by visiting this URL - https://app.datadoghq.com/ (or https://app.datadoghq.eu if you're arriving from Europe)
- Navigate to “Integrations” on the left-side bar
- Search for “Flagsmith”. Screenshot below shows the Flagsmith integration available to add
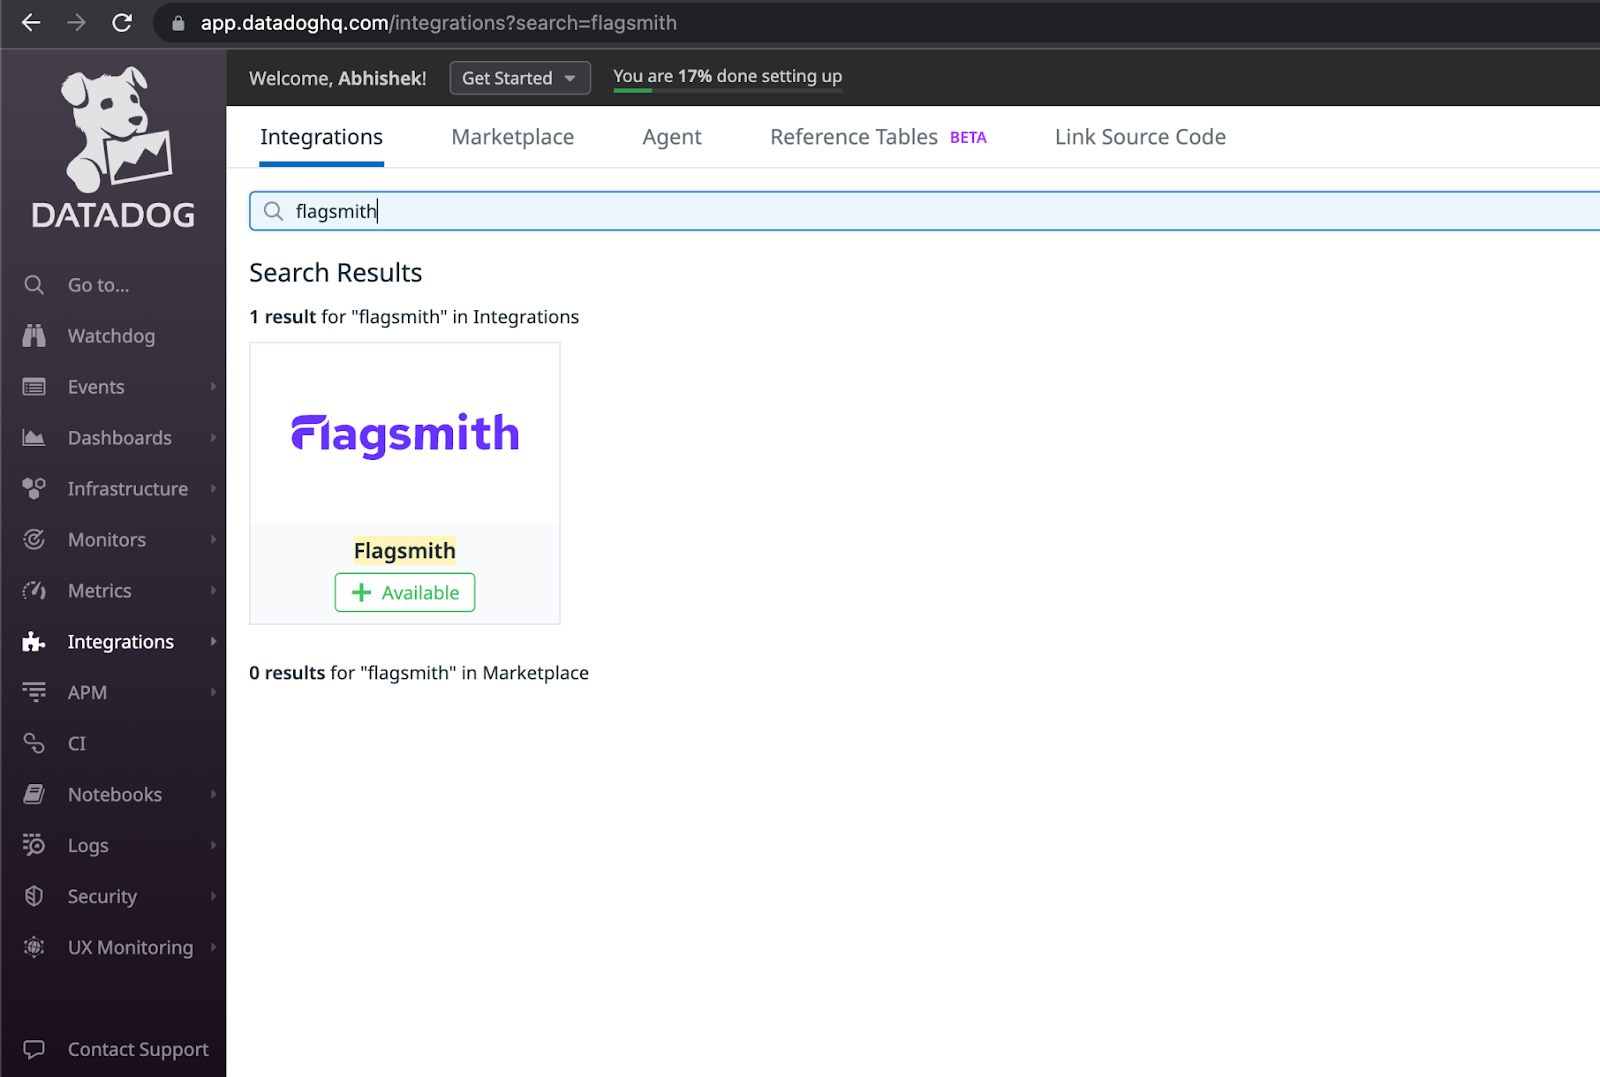
- Click on the “+ Available” sign
- Click on “Install Integration” as shown below
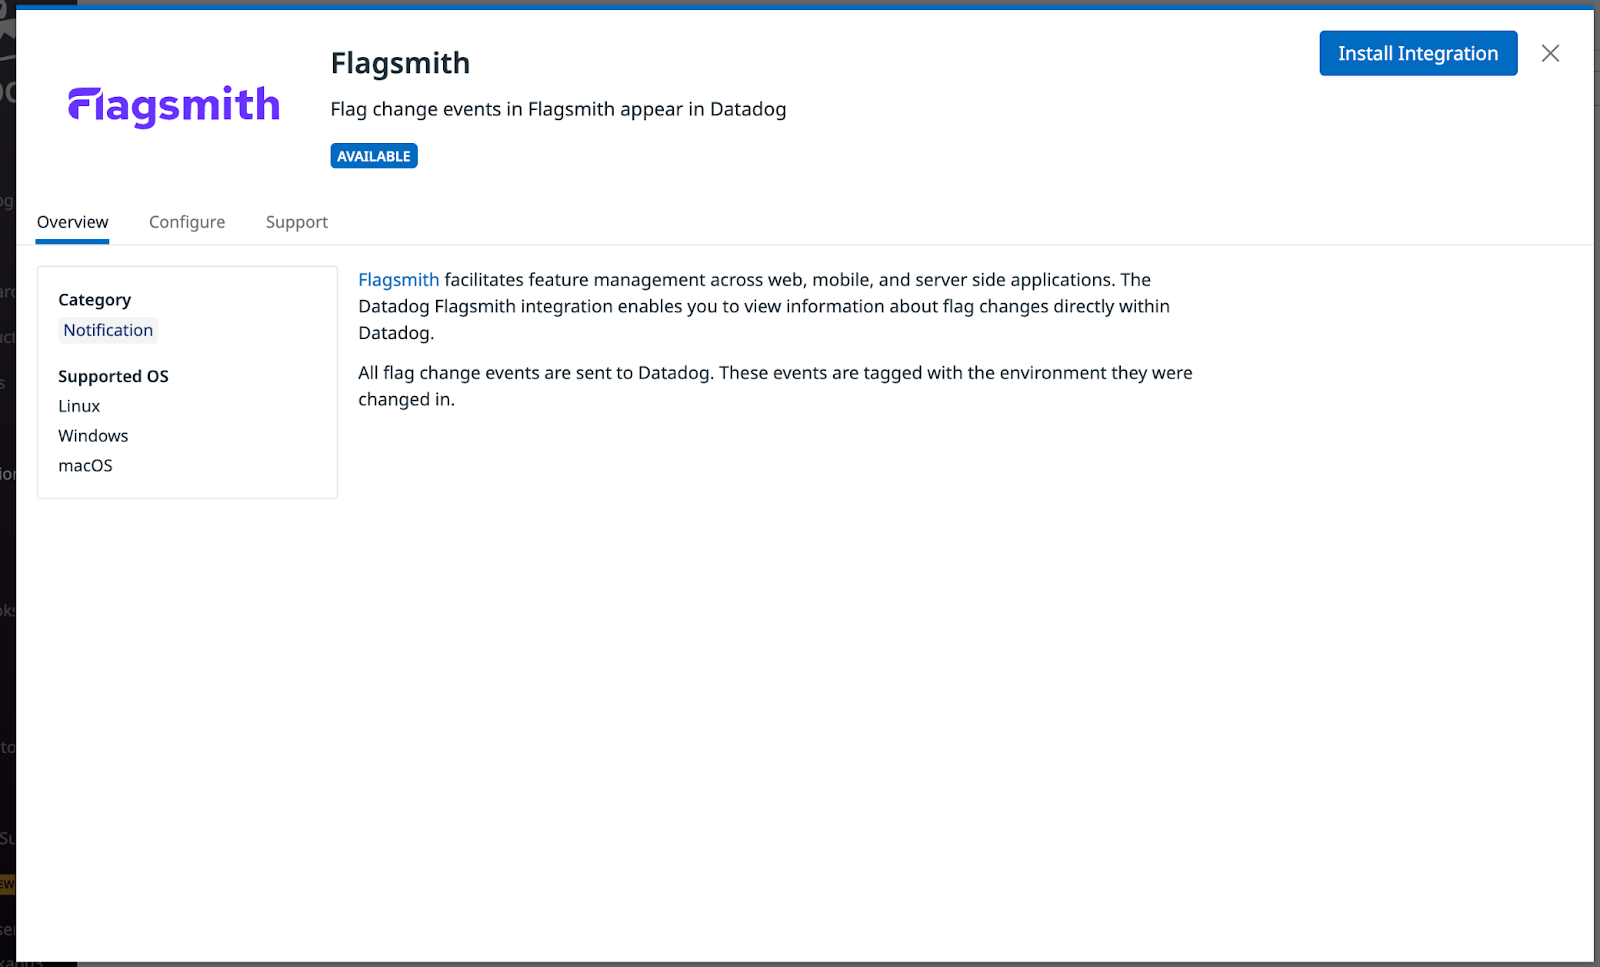
- Once done, you should see the option to Configure the integration
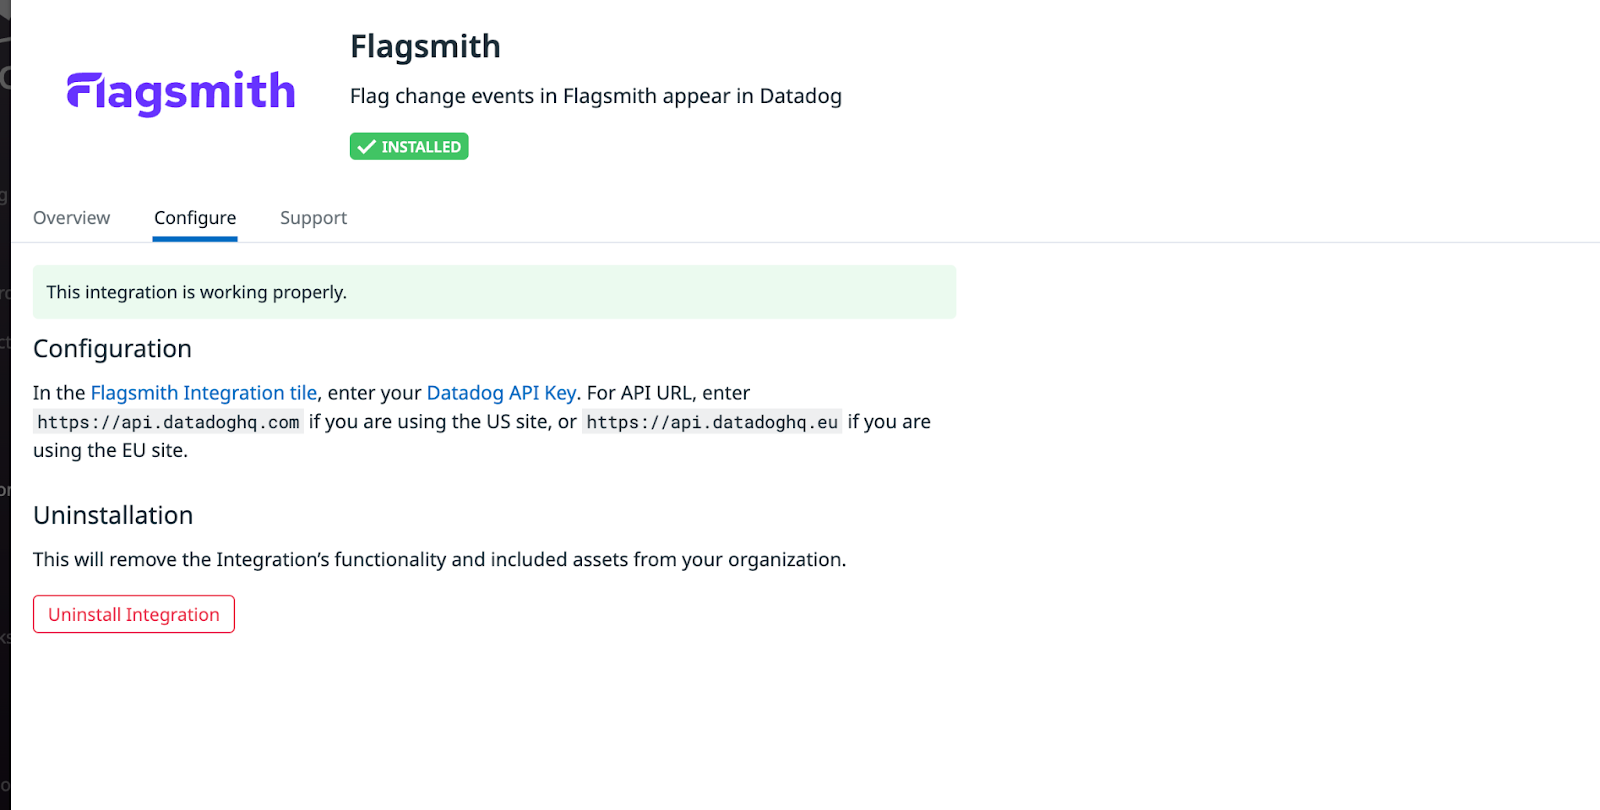
- Click on the “Datadog API Key” Hyperlink (which will take you to https://app.datadoghq.com/organization-settings/api-keys)
- Copy the latest API Key from here. It should look like the one shown below:

Add the Datadog integration on Flagsmith
- Visit https://app.flagsmith.com/projects and select the project that manages feature flags for your current application
- Click on the “Integrations” tab on the left side bar
- Click on “Add integration” beside Datadog
- It will ask you for “Base URL” and “API Key”
- For Base URL: enter https://api.datadoghq.com if you are using the US site, or https://api.datadoghq.eu if you are using the EU site. (This should be in sync with the base URL on your browser’s address bar).
- For API Key: Paste the one you copied above when adding the Flagsmith integration to Datadog.
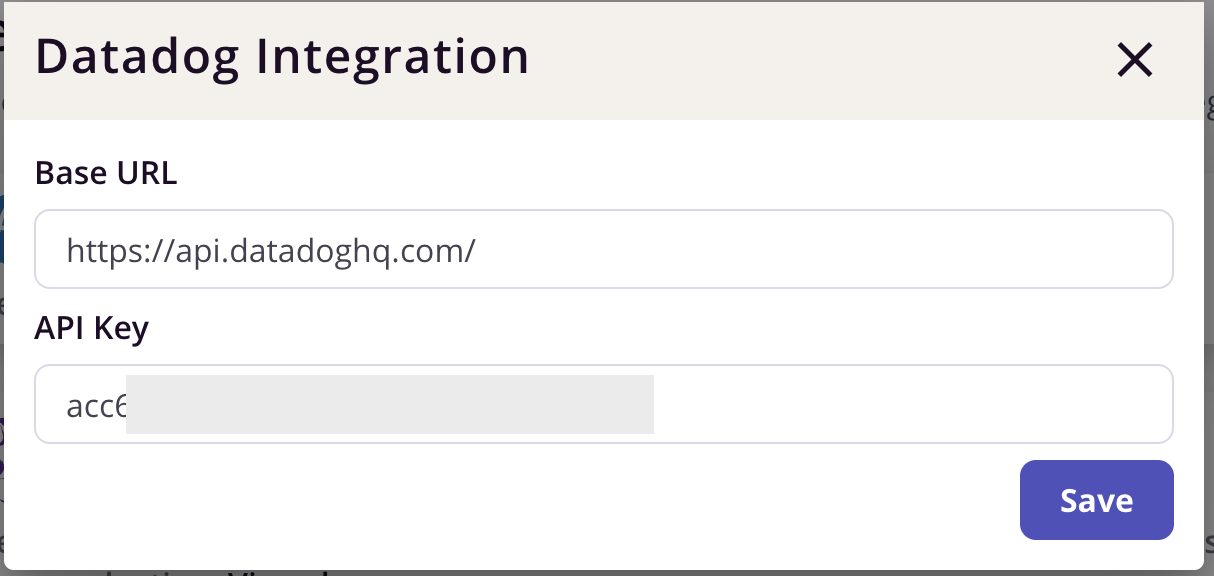
- Click “Save”
Congrats! You have completed the Flagsmith <-> Datadog integration.
Leveraging the integration for your application
Now that the integration is complete, let’s explore the ways to utilize it.
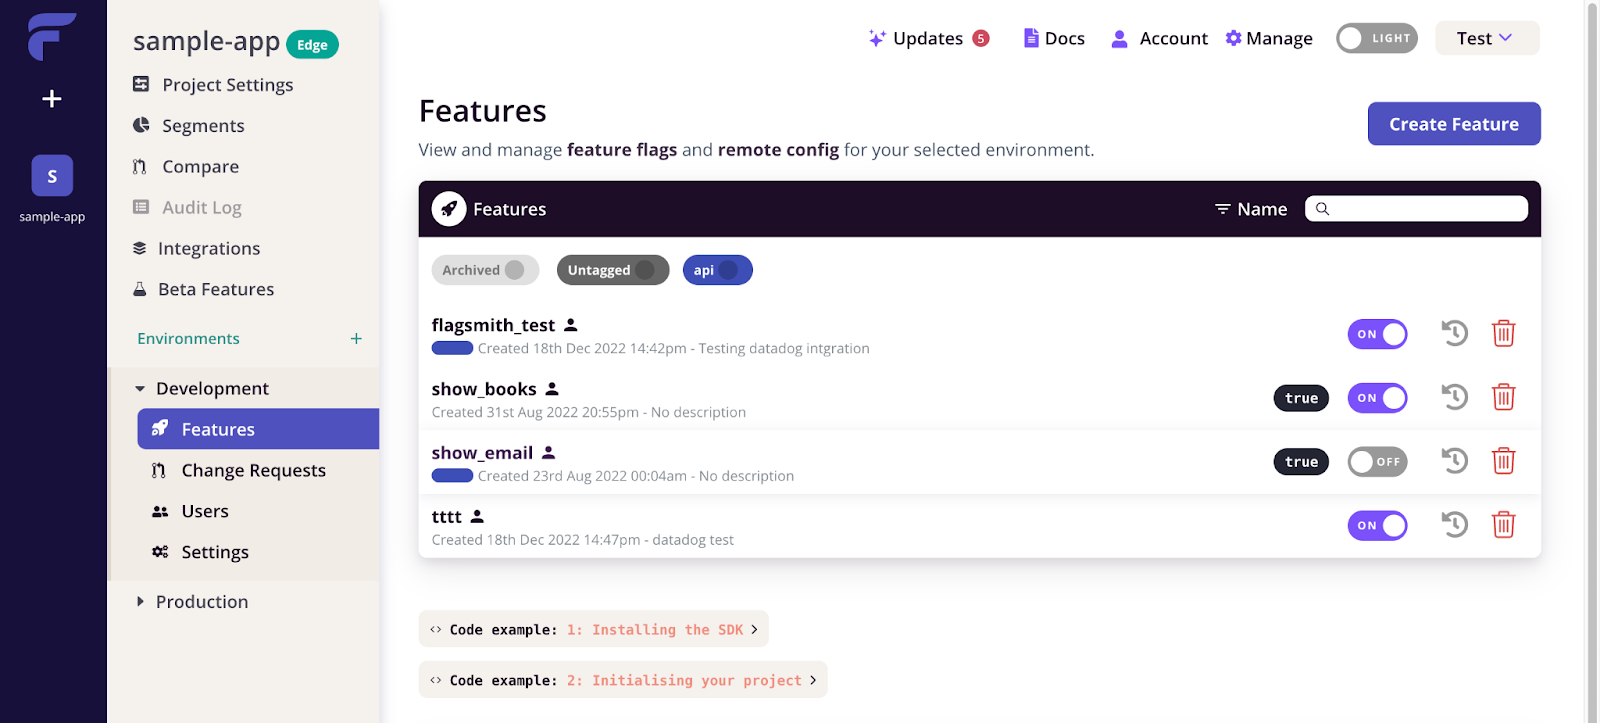
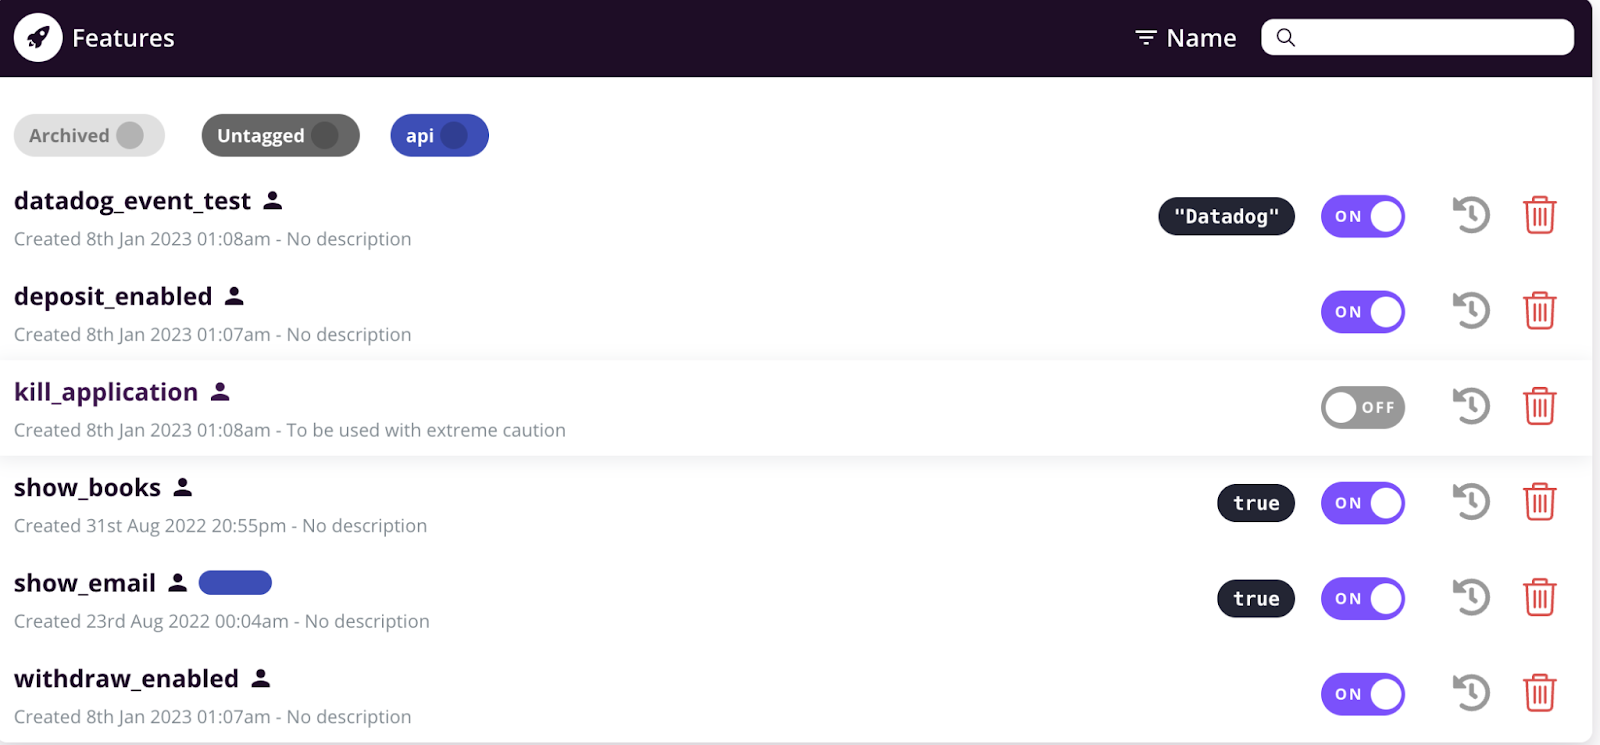
First, let’s try toggling one of the feature flags from our project via the Flagsmith UI.
I made changes to two features named “datadog_event_test” and “deposit_enabled” by turning both of them off. The screenshot below shows the before and after scenario from the Flagsmith UI:

Let’s navigate to the Events section on Datadog.

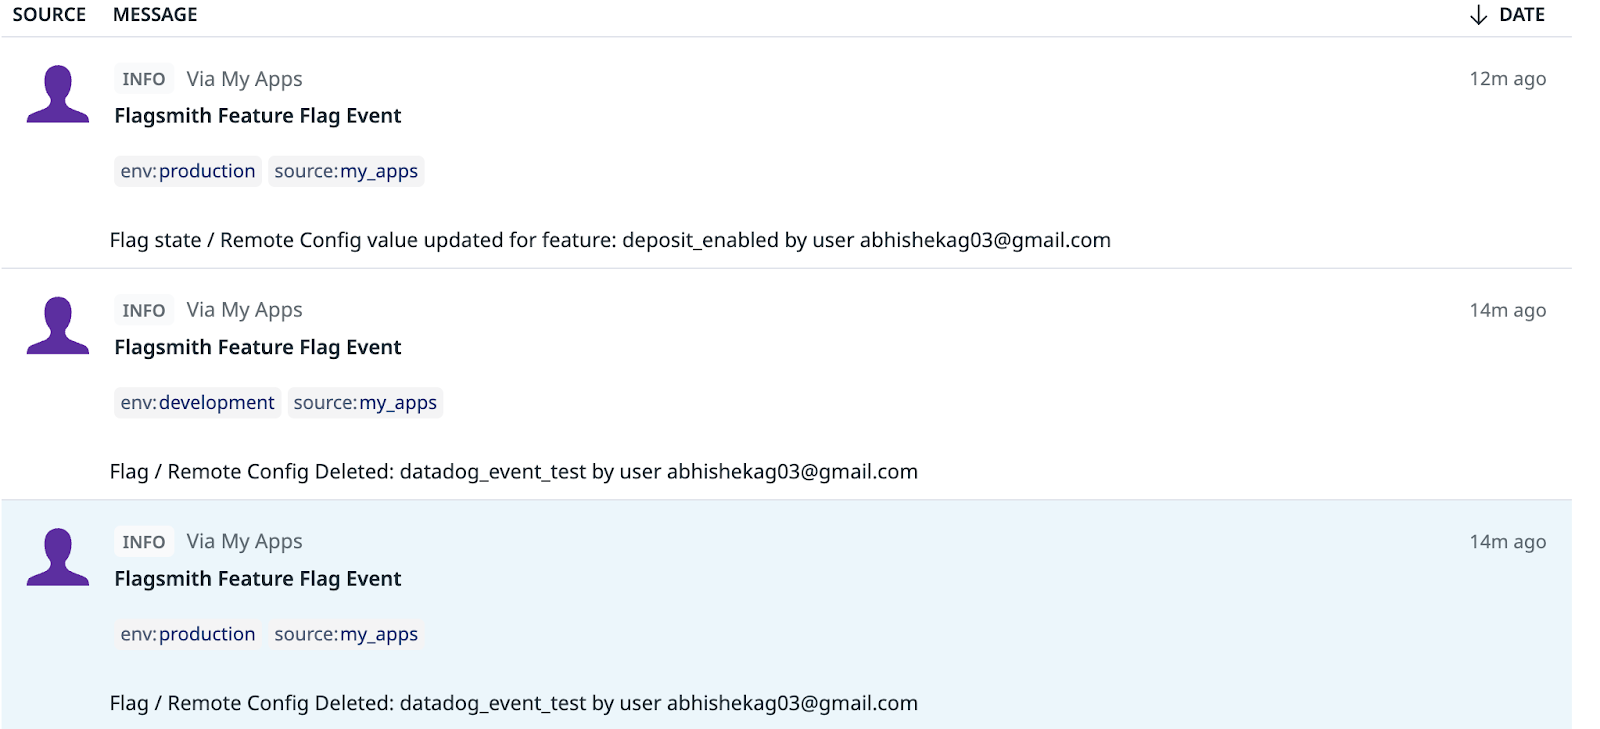
These events appear here magically without any other effort. These events contain explicit information about the following:
- env - this indicates the environment in which the flag change happened. In my case it was “development”
- source - indicates the origin of the event
- description - Contains information about what was changed and who changed it
Thus, we have a complete audit for our feature flag updates in a nice and clean UI.
Managing Feature Flags directly from the Datadog UI
Integrating Datadog with Flagsmith not only enhances the feature flagging experience but also empowers you to conveniently toggle feature flag state directly from the Datadog user interface.
This integration is an incredible time-saving feature that optimises productivity, allowing users to streamline workflows and focus on more important tasks.
To add this integration, simply do the following:
- Open your Datadog dashboard and click on “Add New Widget”
- Search for Flagsmith. You’ll see 2 options - a) Flagsmith - Feature Flags, b) Flagsmith Audit Logs
- Add the “Flagsmith - Feature Flags widget”
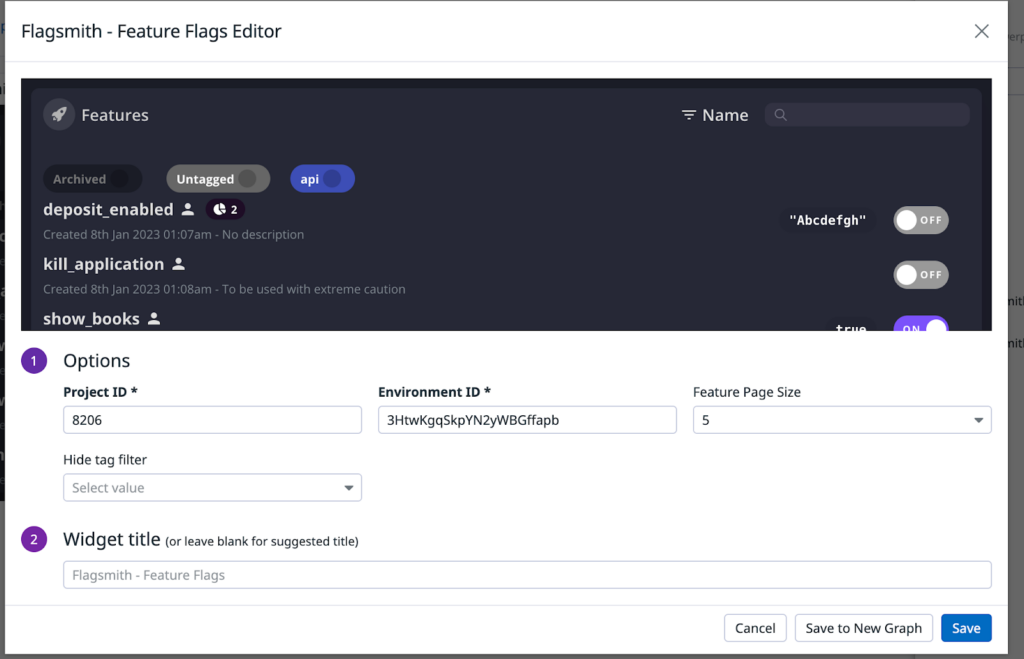
- From the Widget setup UI, choose the
- Organisation
- Project
- Environment
- Copy your Project ID and Env ID from the UI and fill in the boxes as shown below
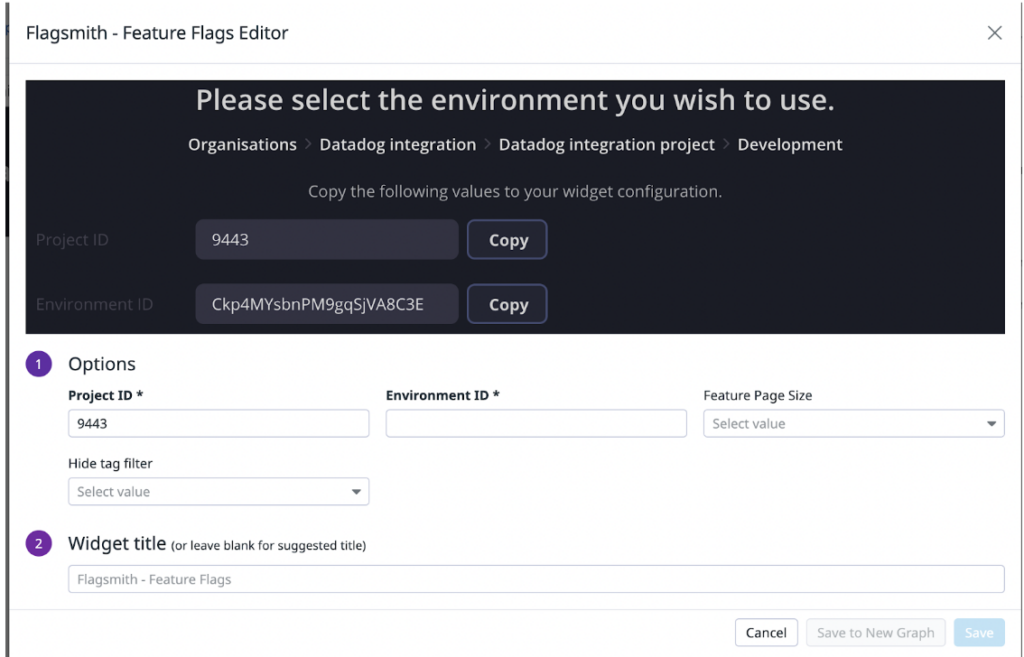
- On entering these details, you should see a preview of the feature flags
Similarly, add the Flagsmith Audit log widget.
This way, you can quickly and easily manage the feature flags state while also reading their audit log.
By utilising this approach, you can efficiently and effortlessly oversee the status of your feature flags, while simultaneously reviewing their activity logs.
Creating Monitors for Effective Event Management: Alerting on Critical Changes
We saw logging events above, now let’s go one step further and create monitors for these events. These monitors can prove to be very helpful when there is an unexpected change.
We can send an alert to the owning members for all changes. This way, they won’t have to rely on checking logs daily.
Ideally monitor alerts should be put in for critical changes only. For example, if a flag has been deleted or updated on the production environment.
Let’s create a monitor that triggers an alert when a feature is deleted in production.
- Navigate to https://app.datadoghq.com/monitors/manage
- Click on “New Monitor”
- Now, under “Custom” click on "Event". This should take you to https://app.datadoghq.com/monitors/create/event
- In the search query, I have put the following:
- source:my_apps env:production message:("Flag Remote Config Deleted *" OR "Flag state Remote Config value updated *")
- Feel free to update the query as per your requirement
- The above query evaluates to true when
- There is an event from the source: “my_apps” AND
- Environment is “production” AND
- Event description contains text related to “Deleted” or “updated” indicating that a flag was deleted or updated.
- Set the alert conditions. I am setting it to alert when there is 1 such occurrence
- Fill in the details based on your team setup for alerting when this occurs
Our monitor is now ready. This will trigger when there is an event satisfying the above conditions.
Navigate back to the Flagsmith UI and update or delete some feature flags. I have deleted one feature and updated another. The corresponding events received are shown below:
On the Datadog monitor UI, it now shows alerts since there are 2 events that satisfy this condition. You can see below that the graph is in red.

Streamlining Real User Monitoring with Datadog and Flagsmith: Tracking Feature Flags and Improving Application Performance
Real User Monitoring (RUM) is a critical aspect of modern application development, providing insights into how users interact with your product in real time. However, as your application scales and becomes more complex, tracking feature flags and their impact on your users can be a challenging task.
Fortunately, Datadog's integration with Flagsmith makes it easy to streamline your RUM data and track feature flags without needing to navigate between multiple services. This integration allows you to enrich your RUM telemetry with data collected from Flagsmith, providing a more comprehensive understanding of how feature flags affect your application's performance and user experience.
With Flagsmith's out-of-the-box dashboards and audit logs, you can effortlessly monitor feature flag activity and quickly investigate any emergent issues. The integration with Datadog RUM enables you to track feature flags and their impact on the rest of your application, all within a single, unified monitoring platform.
As an example, suppose you are a social media company monitoring your platform's engagement metrics, and you notice a sudden drop in user activity. You receive an alert notifying you of this issue, and upon checking your RUM dashboard you notice that a newly released feature flag for a new messaging feature was recently toggled on. By checking your Flagsmith widget and identifying the problematic flag, you can roll it back and address the issue before redeploying the feature. This process can help you pinpoint the root cause of any performance issues and enable you to take corrective actions more efficiently.
The RUM analytics help us analyse which features are enabled for a particular user. Upon noticing anything unusual, we can view the flags, audit logs and the current state to figure out the cause for that behaviour.
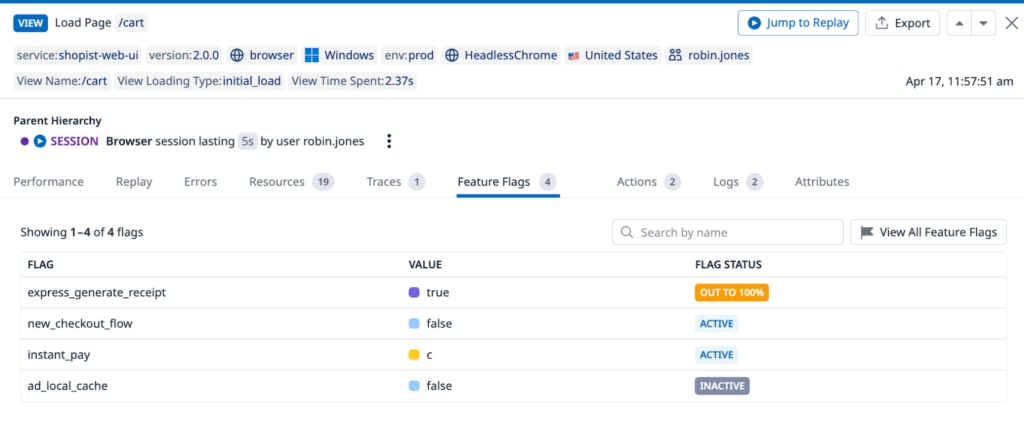
The below screenshot shows the Feature Flag data for the user Robin Jones. As we can see:
- “express_generate_receipt” flag is rolled out to 100%
- “new_checkout_flow” flag is Active for the user and its value is set to false
- “instant_pay” is active for the user
- “ad_local_cache” is inactive for the user
Now, we can check the audit logs for these 4 features. If any of them was recently updated, that should be the probable cause for seeing reduced user engagement on the platform.
Wrapping it up!
That’s all for this tutorial. Hope this helps make integrating Flagsmith and Datadog with your application seamless. Feel free to get in touch with any questions about how this integration could help you.


OpenTelemetry, without the vendor lock-in: Introducing full observability for Open Source and Self-Hosted Flagsmith customers


.png)
.png)
.png)

.png)


.png)


.webp)